


Breakdown Analysis Shows Deeper Correction Possible- Bitcoin Price at Risk?
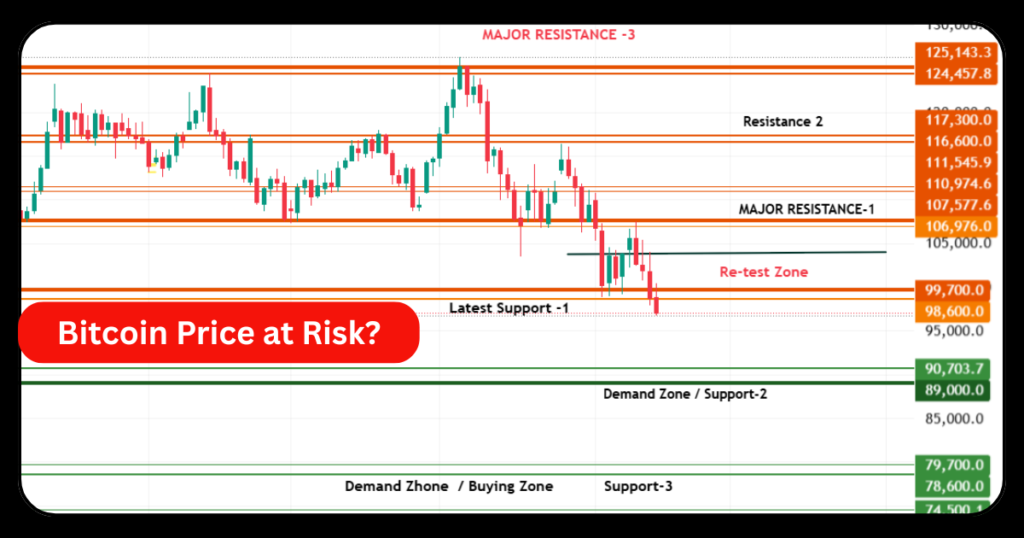
Bitcoin (BTC) continues to show weakness on the daily timeframe as the price slips below major support levels, raising concerns about further downside movement. According to the latest chart structure, BTC is struggling to stay above the $99,700 – $98,600 zone, which recently acted as the Latest Support-1. The breakdown and subsequent retest of this level are critical indicators suggesting that Bitcoin may enter a deeper corrective phase.
At the same time, global sentiment is also showing early signs of caution. Morgan Stanley strategists, as reported by CoinMarketCap, say that the crypto market has entered the “fall season” of Bitcoin’s four-year cycle—a period historically marked by cooling momentum, re-evaluation of institutional strategies, and preparation for potential market shifts. When technical breakdowns align with cyclical cooling, traders must navigate the market with discipline and clear risk management.
BTC/USD: Breakdown From Latest Support-1
The price has decisively broken below the $99,700 – $98,600 support range. This area was holding the market for several sessions, but bearish pressure eventually overcame buyers.
Now, BTC is retesting this broken support from below—an important technical behavior.
- If the price fails to reclaim this zone, the breakdown will be validated.
- Sellers may then continue pushing the market toward lower demand zones.
- A daily close above $99,700 would be required for any short-term bullish recovery.
Since June 2025, BTC has been forming a lower-high, lower-low structure, indicating a multi-month downtrend. Each bounce has been stored lower than the previous one, confirming ongoing weakness.
Major Resistances That Bitcoin Must Overcome
Major Resistance-1 ($110,974 – $107,577)
This zone caused the latest major rejection. BTC attempted to bounce multiple times but failed, triggering the current downward slide.
Resistance-2 ($117,300 – $111,545)
A cluster of strong selling pressure. Even if BTC recovers in the short term, this region will be a tough barrier.
Major Resistance-3 ($125,143 – $124,457)
Long-term resistance where large players have consistently booked profits. A break above this zone would indicate the start of a new bullish phase, but current conditions suggest this level is far from reach.
Support & Demand Zones Below Current Levels
As BTC weakens, traders must watch the next key supports:
Demand Zone / Support-2 ($90,703 – $89,000)
If the breakdown is validated, this becomes the next major destination. Historically, buyers have shown interest around this region.
Support-3 / Major Buying Zone ($79,700 – $78,600)
A deeper correction could take Bitcoin into this buying zone. Long-term investors often accumulate here.
Extension of Support ($74,500 – $73,700)
This is the lowest support timeframe on your chart. Only strong panic or extreme negative macro sentiment could pull BTC down to this range.
Macro Sentiment: Morgan Stanley’s “Fall Season” Warning
According to Morgan Stanley strategists, the crypto market has now entered the fall season of Bitcoin’s four-year cycle. Historically, this season is known for:
- Weak price momentum
- Increased volatility
- Institutional re-evaluation of positions
- Market preparation for the next major cycle decision point
Institutional investors are reportedly reassessing their strategies, anticipating potential market shifts. This aligns directly with Bitcoin’s current technical behavior:
- Breakdown from key support
- Lower-low formations
- Failure to reclaim strong resistance zones
- Decreasing bullish momentum
When technical weakness meets cyclical cooling, the risk of deeper correction increases.
Is Bitcoin Price at Risk? Final Outlook
Based on the current daily chart structure and broader market commentary:
✔ Bitcoin is at risk of further decline, especially if it cannot reclaim $99,700 – $98,600.
✔ Lower supports at $90,703, $79,700, and even $74,500 may come into play.
✔ Institutional caution during the “fall season” adds additional pressure.
✔ A strong reversal requires a daily close above $99,700, followed by a move toward Major Resistance-1.
For now, technicals and cycle sentiment both point toward continued downside or sideways consolidation unless buyers show strong commitment.
Here are the same 3 FAQs rewritten in plagiarism-free, simple 2-line answers:
FAQ
1: What does it mean that Morgan Stanley says Bitcoin is in its “fall season”?
Morgan Stanley refers to the “fall season” as a phase in Bitcoin’s four-year cycle when price momentum cools down.
During this period, institutions usually reassess their positions and prepare for possible trend shifts.
2: How are institutional flows and liquidity behaving in the current crypto market?
Recent market data suggests institutional inflows and overall crypto liquidity have slowed after months of growth.
This stagnation often increases volatility and limits strong upside movement in the short term.
3: What are some near-term technical risks for Bitcoin based on recent analysis?
Bitcoin falling below key psychological and technical levels has increased the risk of deeper corrections.
Macro uncertainties and reduced liquidity are adding pressure to the current trend.