


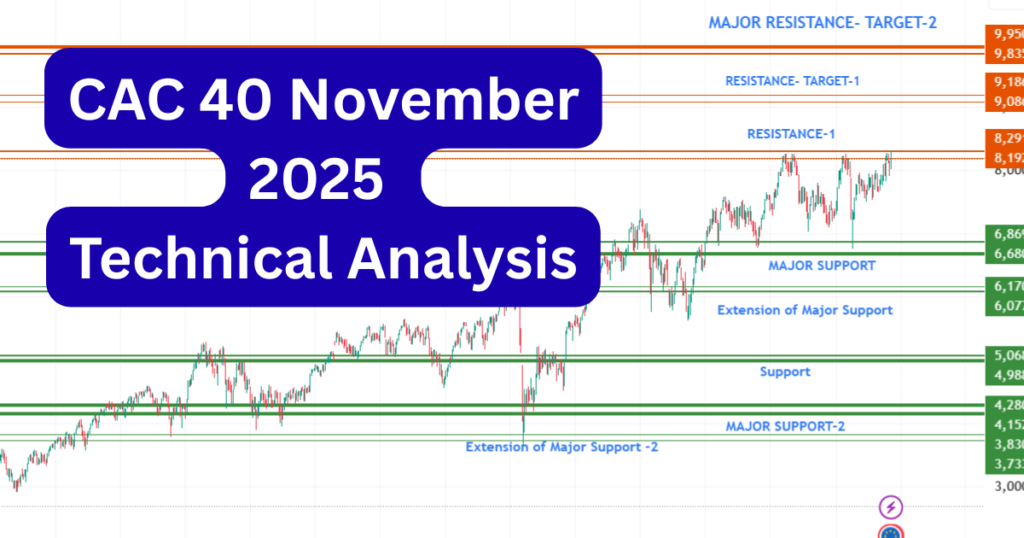
CAC 40 Technical Analysis – Chart-Based Trend Outlook (France Index)
The CAC 40 Index, the benchmark stock market index of France, is showing a strong technical structure on the long-term chart.
Based on drawn levels, the index is preparing for a potential upside continuation after weeks of consolidation and repeated attempts to break higher. The price is currently trading around 8190+, right below major resistance, making this a crucial turning point for the French market.
Along with this, global market behaviour is also turning supportive. Profit booking is visible in Bitcoin and gold, while natural gas and crude oil are showing early signs of an uptrend. This shift often indicates increasing risk appetite among investors—something that typically benefits equity indices like the CAC 40.
CAC 40 – Chart Technical Analysis
(Major Zones Explained)
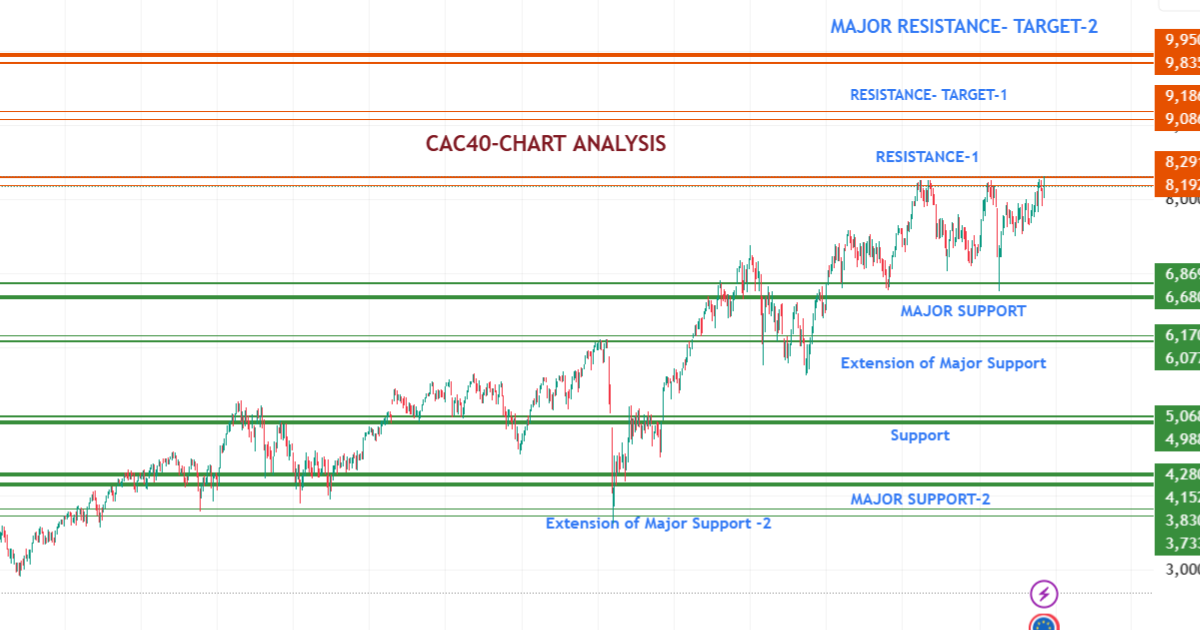
The following breakdown is entirely based on the support–resistance levels marked on your chart.
1. Immediate Resistance Zone (Resistance-1: 8291–8192)
The CAC 40 is testing this zone right now.
What the chart shows:
- Price has previously reversed from this area multiple times.
- Strong sellers are active near 8300, making it a psychological barrier.
- A weekly candle closing above 8300 can open the path for a strong bullish rally.
Currently, price is pushing into this level with momentum, showing that buyers are attempting a breakout.
2. Next Bullish Target – Resistance-Target 1 (9186–9086)
If the index manages to close above the immediate resistance, this zone becomes the next destination.
Chart meaning:
- This is a heavy supply zone, seen from past price reactions.
- A clean breakout from Resistance-1 could bring a sharp rally toward 9000–9200.
- Upside potential increases significantly once this level is crossed.
3. Major Resistance – Target 2 (9950–9835)
This is your chart’s highest marked resistance.
Technical interpretation:
- If CAC 40 enters this zone, it means a multi-year breakout.
- Heavy volatility is expected because long-term investors tend to book profits here.
- Reaching this level would mark a strong bullish cycle for the French market.
This zone represents long-term upside potential if global conditions remain favourable.

Support Structure – Foundation of CAC 40 Trend
4. Major Support (6869–6680)
This support zone has acted as a major turning point in multiple market cycles.
What the chart reveals:
- Each time the index dipped here, buyers absorbed the fall quickly.
- It is a long-term accumulation zone.
- As long as CAC 40 stays above this region, the broader trend remains bullish.
5. Support Zone (6170–6077)
This is the next defensive support below major support.
Chart behaviour:
- Market has bounced multiple times in the past from this zone.
- It acts as a safety net during medium retracements.
- Institutions typically accumulate positions here.
If price corrects sharply, traders will watch this level closely.
6. Major Support-2 (4280–3733)
This is the deepest demand zone on your chart.
Interpretation:
- Historically, this level marked the bottom of major market corrections (2020 crash kind).
- If CAC 40 ever comes back here, it signals a strong buying opportunity.
- Long-term investors treat this as a value zone.
This level is far below current market price, but it provides important context for extreme market conditions.
Trend Outlook Based on Chart
The overall long-term structure clearly suggests that:
✔ CAC 40 remains in an uptrend
- Higher highs and higher lows visible.
- Price is trading above all major support zones.
- Momentum candles indicate strength near major resistance.
✔ Global signals support the bullish trend
- Profit booking in Bitcoin and gold shows investors shifting toward equities.
- Natural gas and crude oil showing uptrend signals → indicates improving economic sentiment.
- Global equity indices are stabilizing or turning bullish.
These external factors add confidence that CAC 40 may soon attempt a breakout.
Final Outlook – What to Expect Next
If CAC 40 breaks above 8300, the next logical targets are:
- 9000–9200 (Target 1)
- 9800–9950 (Major Target 2)
On the downside, 6860–6680 remains the strongest support protecting the trend.
Overall, your chart clearly reflects a market that is preparing for a bullish continuation, backed by strong support levels and improving global market sentiment.
FAQs
1. What country does the CAC 40 Index belong to?
The CAC 40 Index belongs to France and represents the top 40 companies listed on the Euronext Paris Stock Exchange.
2. Is the CAC 40 showing a bullish trend in November 2025?
Yes. Based on current chart levels, the CAC 40 is approaching a major breakout zone, indicating a strengthening bullish trend for the coming weeks.
3. What are the key resistance levels for the CAC 40 right now?
The major resistances are around 8290, followed by 9080–9180, and a long-term target zone near 9835–9950.
4. What global factors are supporting the CAC 40 uptrend?
Profit booking in Bitcoin and Gold and rising momentum in Crude Oil and Natural Gas are shifting investor interest toward equities, helping support the CAC 40.