
🚨 BTC CRASH NEWS: Bitcoin Wipes Out 2025 Gains — Price Tests First Demand Zone Near $89,000
Bitcoin is under intense selling pressure as the world’s largest cryptocurrency has now erased all of its 2025 gains, falling nearly 30% from its October all-time high of $126,000. For almost 30 straight days, BTC has been in a clear downtrend, and the latest daily chart signals that Bitcoin is now standing at a crucial make-or-break level.
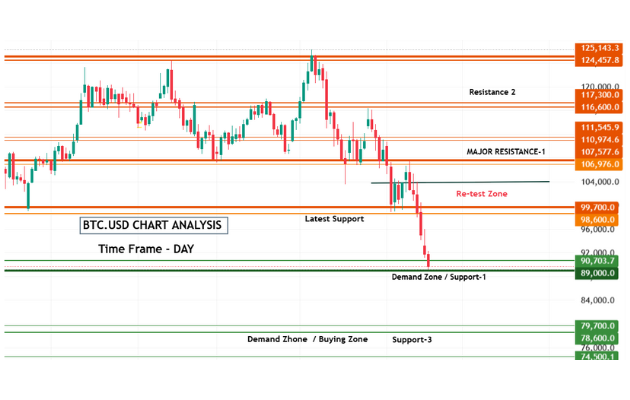
According to the latest chart analysis (Time Frame: 1D), BTC has dropped sharply toward its First Demand Zone / Support-1 around $89,000 – $90,700, marking one of the steepest monthly declines of the year. Traders, long-term investors, and even large institutions are now watching whether Bitcoin can sustain above this support or break below — which could trigger deeper selling.
Why Is Bitcoin Price Falling? What’s Putting BTC Under Pressure?
Despite strong bullish sentiment earlier in the year, several major factors have created a perfect storm for Bitcoin:
1️⃣ Massive Profit-Booking After ATH
Bitcoin rallied aggressively to cross $126,000 in October 2025, attracting heavy speculative buying. But after the price hit an exhaustion zone, big players started booking profits, leading to continuous selling pressure.
2️⃣ Uncertainty Around US Interest Rate Cuts
The US Federal Reserve has not offered clarity on the timeline for interest rate cuts. Higher interest rates typically drag down risk assets like Bitcoin.
Investor sentiment has turned cautious, and traders are unwilling to add fresh long positions until clarity emerges.
3️⃣ Government Shutdown Fears
The rising concern of a possible US Government Shutdown has also dented crypto markets. Such macro uncertainties force investors to pull money out of volatile assets such as Bitcoin.
4️⃣ Crypto Industry Voices Calling This a Buying Opportunity
Gemini co-founder Cameron Winklevoss told investors on Tuesday that:
Bitcoin under $90,000 may be a last chance to buy before the next big cycle.
His statement has sparked debate in the market — is this the bottom or could BTC drop much lower?
Astrology Signals Also Add Market Curiosity
Interestingly, even astrology followers in the crypto community are connecting the recent planetary alignments with market volatility.
According to them, the combination of Saturn’s movement and Mercury retrograde during November often signals uncertainty, corrections, or downward breakouts in speculative markets like Bitcoin.
While not scientific, these discussions often trend heavily on social media during major BTC moves.
Technical Breakdown: What the Chart Is Saying
Your BTC/USD day-chart shows a very clear structure:
🔶 First Demand Zone / Support-1: $89,000 – $90,700
Bitcoin is now exactly touching this level.
This zone is crucial because this was a previous strong accumulation region.
- If BTC sustains:
First upside target → $93,000 - If BTC bounces strongly:
Extended recovery targets → $98,600 / $99,700 (Re-test zone)
🔴 If BTC breaks below the support
Then downside opens aggressively.
Next support levels:
- $83,000 – First Downside Target
- $79,700 – $78,600 (Demand Zone / Support-3)
- Extreme panic support → $73,700
A breach below $89,000 could trigger another wave of selling as stop-losses of short-term traders get hit.
NEWS SUMMARY
Bitcoin is in trouble — and the market knows it.
After touching a record high above $126,000, BTC has crash-landed near $89,000, wiping out nearly 30% in just one month. The sentiment is shaky, volatility is rising, and macro uncertainty has become the biggest enemy of crypto bulls.
Yet this fall also brings opportunity. Some experts are calling this the final discount zone before a possible new rally, especially if the U.S. announces rate cuts early next year.
- Now all eyes are on the crucial $89,000 support.
- Hold this — and recovery begins.
- Break this — and Bitcoin could bleed down to $83,000 or even $79,700.
- The next 2–3 days will decide Bitcoin’s direction at the end of 2025.