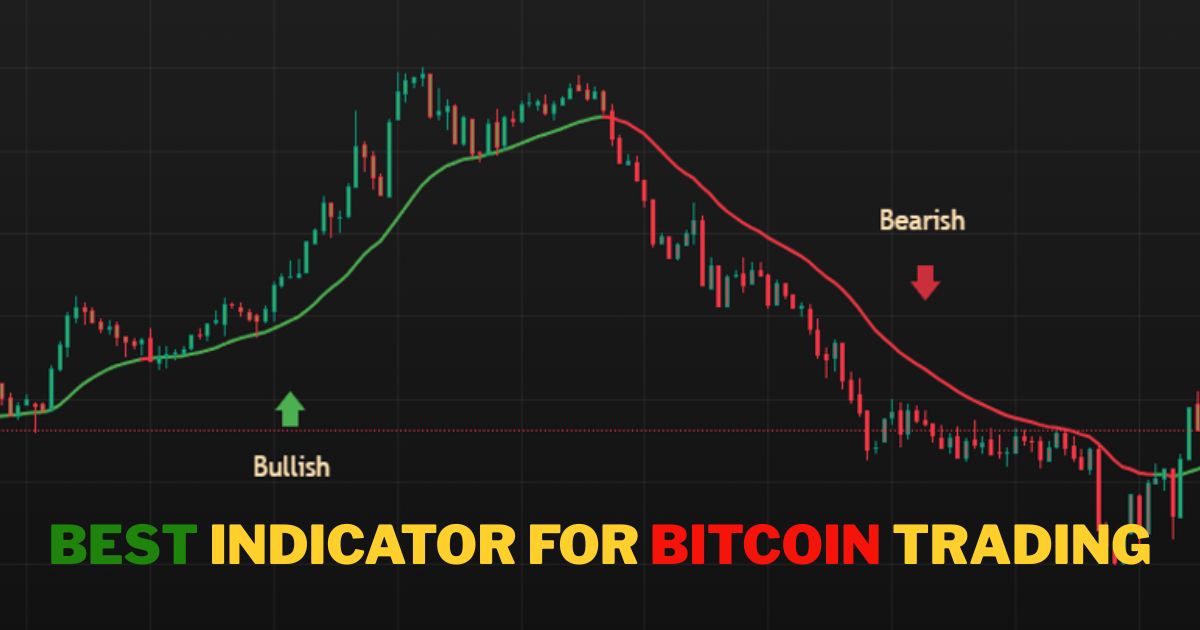
Which Technical Indicators Are Best for Bitcoin Trading?
Bitcoin is one of the most volatile cryptocurrency, in the Trading world and choosing the right technical indicators can improve trading accuracy.
Among the many tools available to traders, Quadratic Moving Average (QMA) and the SMA-44 Channel Breakout Strategy are popular because of their flexibility and high accuracy, especially in fast-moving market conditions.
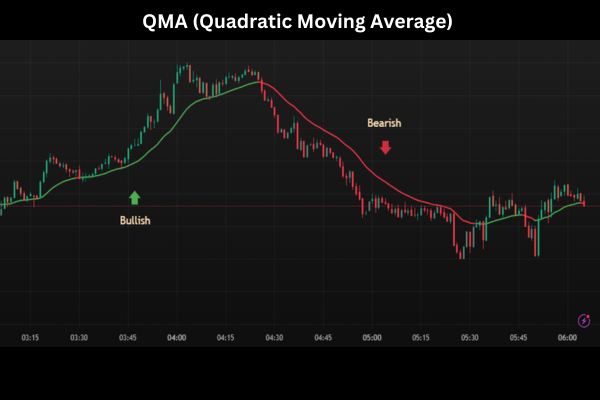
Why QMA (Quadratic Moving Average) Is the Best Indicator for Bitcoin Trading
Bitcoin moves quickly and reacts sharply to market news, Standard indicators like SMA and MACD often lag, which leads to late trend entries or misleading signals during high volatility. QMA solves this problem by adjusting dynamically to price changes.
Here’s why QMA is considered superior:
1. Reduced Lag With Higher Smoothness
QMA responds quicker than SMA and EMA while still staying smooth. This helps show trend direction more clearly and reduces unnecessary whipsaws during fast market moves.
2. Adapts to Volatile Markets
Because Bitcoin often experiences sudden pumps and dumps, QMA’s mathematical structure allows it to adjust more efficiently than other indicators.
3. Accurate Trend Identification
Traders get earlier confirmations of trend reversals and momentum shifts crucial in crypto where price moves can be extremely sharp.
In short, QMA is one of the best trend-following indicators for Bitcoin, especially for intraday trading, short term swing trading.
READ MORE – Breakdown Analysis Shows Deeper Correction Possible- Bitcoin Price at Risk?
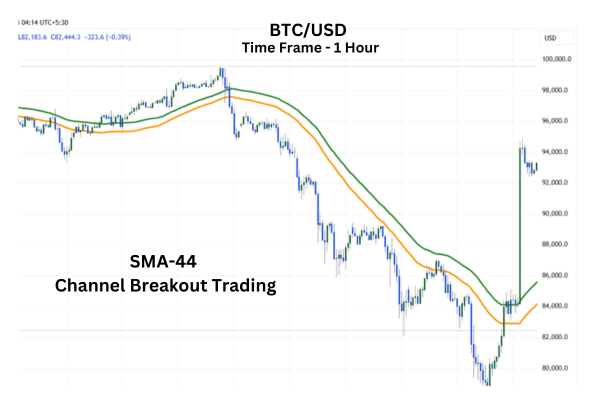
SMA-44 Channel Breakout Strategy for Consistent Profits
If you prefer a simple yet powerful price-action-based method, the SMA-44 Channel Breakout Strategy is highly effective. It is made by us using two Simple Moving Averages
- SMA (44, High) → Upper boundary → Acts as resistance
- SMA (44, Low) → Lower boundary → Acts as support
These two lines create a price channel that helps traders identify both trend direction and breakout opportunities.
How the SMA-44 Channel Strategy Works
1. Bullish Breakout (Buy Signal)
A buy signal occurs when:
✔ Price closes above the SMA-44 high
This indicates that buyers are taking control. A long position can be taken with
👉 Stop-loss below SMA-44 low candle closing
2. Bearish Breakout (Sell Signal)
A sell signal occurs when:
✔ Price closes below the SMA-44 low, This indicates strong downward momentum.
A short position can be initiated with:
👉 Stop-loss above SMA-44 high candle closing
3. Support and Resistance Behavior
- Price bouncing off SMA-44 low = strong support
- Price rejecting SMA-44 high = strong resistance
This makes the channel useful for both breakout and reversal trading.
Why Traders Love the SMA-44 Breakout Strategy
- Beginner-friendly – Easy to understand and implement on chart
- Trend confirmation – Avoids fake signals ,most of time
- Multi-timeframe compatibility – Works on 5-min, 1-hr, daily charts
- Reliable stop-loss placement – Reduces emotional trading
With strong risk management, this strategy consistently improves trade accuracy and profitability.
What Factors Influence Bitcoin’s Price Volatility?
Bitcoin’s price is highly sensitive and can change drastically within minutes. This volatility is driven by several key factors:
1. Hyper-Reactive Market News
Breaking news – such as ETF approvals, exchange hacks, regulatory announcements, or macroeconomic shifts can instantly trigger aggressive buying or selling.
2. Leveraged & Algorithmic Trading
Crypto markets are filled with leveraged positions.
Liquidations often lead to massive cascades, amplifying volatility.
Algorithmic bots further accelerate price movements.
3. Market Psychology
Fear, greed, FOMO, and panic selling shape Bitcoin’s short-term volatility. Since many traders react emotionally, price swings become sharper.
4. Impact of the Dollar Index (DXY)
The U.S. Dollar Index has a strong correlation with Bitcoin:
- Strong DXY → Crypto Weakness
Investors prefer traditional safe assets. - Weak DXY → Crypto Strength
Traders shift funds into Bitcoin and risk-on assets.
Thus, macroeconomic trends in the global currency market directly influence Bitcoin momentum.
5. Supply & Demand Dynamics
Bitcoin’s capped supply of 21 million creates scarcity.
But demand fluctuates based on retail interest, institutional participation, and global liquidity cycles. This imbalance often leads to sudden spikes .
Final Words
- Bitcoin is still largely driven by speculation rather than fundamental
- Using advanced tools like QMA and practical strategies like the SMA-44 Channel Breakout can significantly enhance your trading performance.
- At the same time, understanding the macro factors influencing Bitcoin’s volatility helps you stay ahead of market trends and avoid unnecessary risks.
FAQ
1: What makes QMA better than traditional moving averages for Bitcoin trading?
QMA reduces lag and reacts quickly to sudden price movements, which is essential in Bitcoin’s highly volatile market.
It provides smoother trend signals and helps traders enter and exit positions with better accuracy.
2: Does the SMA-44 Channel Breakout Strategy work on all timeframes?
Yes, SMA-44 works effectively on intraday, swing, and even long-term charts.
Traders often use multiple timeframes to confirm breakouts and avoid false signals.
3: Why does the Dollar Index (DXY) influence Bitcoin’s price?
A rising DXY strengthens the U.S. dollar, causing investors to shift away from risk assets like Bitcoin.
When the dollar weakens, Bitcoin typically gains as liquidity flows back into crypto.
4: Is Bitcoin’s volatility mainly driven by news events?
News is a major driver, but leveraged trading, market psychology, and algorithmic bots also play key roles.
These factors combine to create rapid price swings that are unique to the crypto market.